AR spectral estimation from reflection coefficients
Tutorial goal
Estimate an all-pole spectrum from a stable adaptive model.
Note
New to the terminology? See the lattice DSP concept map and the causality/data-use guide for how online, offline, block, and MIMO examples should be read.
Context
This example turns stable AR/lattice parameters into a spectral plot. It is useful because many readers understand an estimated model more quickly from its frequency response than from coefficient lists.
Key idea and equations
For an all-pole AR model, the spectral shape is proportional to
\[S(\omega) \propto \frac{1}{|A(e^{j\omega})|^2}.\]
How to read the result
The learned spectrum should follow the true all-pole spectrum, especially near the dominant resonances.
Run command
python examples/ar_spectral_estimation.py
Run status
Return code: 0
Captured stdout
true reflection: [0.72, -0.48, 0.24]
learned reflection: [0.035, -0.0369, -0.0881]
initial prediction MSE: 0.0652963118535798
final prediction MSE: 0.0642074395182556
Figures
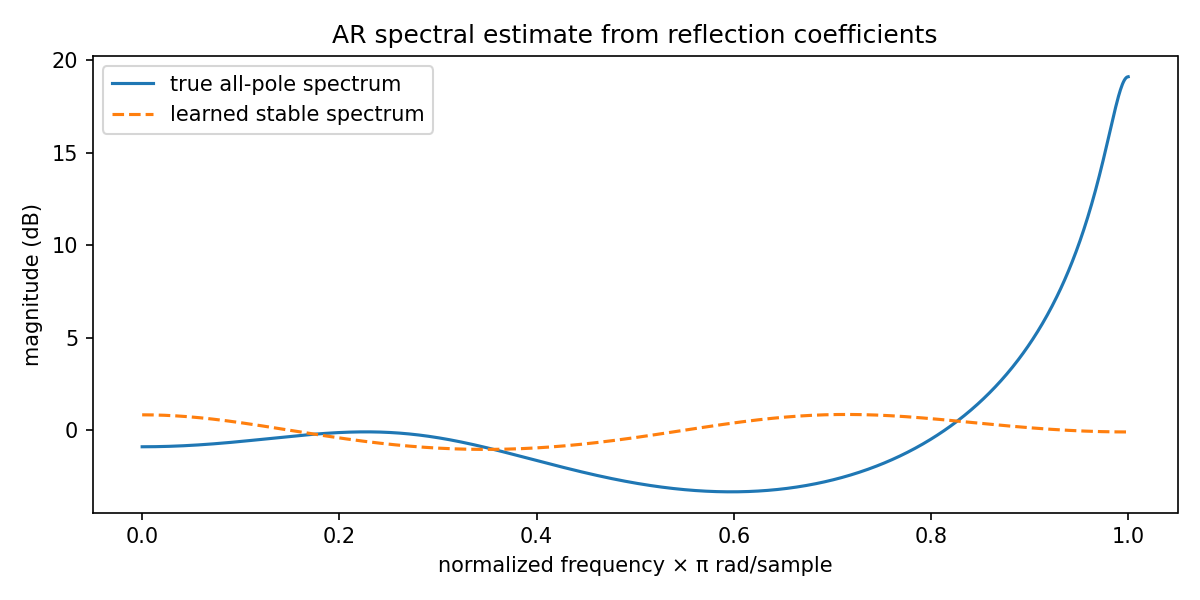
ar_spectral_estimation.png
Source code
 1"""AR-style spectral estimation with reflection coefficients.
 2
 3A stable all-pole process is generated from known reflection coefficients.  A
 4small adaptive predictor estimates a stable recursive model, then the true and
 5learned spectra are compared.
 6"""
 7
 8from __future__ import annotations
 9
10import os
11from pathlib import Path
12
13import numpy as np
14
15from lattice_dsp import AdaptiveLatticeLadderNLMS, LatticeIIR, reflection_to_denominator
16
17
18def response_db(
19    numerator: np.ndarray, denominator: np.ndarray, n_fft: int = 1024
20) -> tuple[np.ndarray, np.ndarray]:
21    omega = np.linspace(0.0, np.pi, n_fft)
22    z = np.exp(-1j * omega)
23    b = sum(float(coef) * z**i for i, coef in enumerate(numerator))
24    a = sum(float(coef) * z**i for i, coef in enumerate(denominator))
25    h = b / np.maximum(np.abs(a), 1e-12)
26    return omega / np.pi, 20.0 * np.log10(np.maximum(np.abs(h), 1e-12))
27
28
29def artifact_dir() -> Path:
30    """Return the directory for generated figures/data."""
31
32    path = Path(os.environ.get("LATTICE_DSP_ARTIFACT_DIR", "reports/example-artifacts"))
33    path.mkdir(parents=True, exist_ok=True)
34    return path
35
36
37def main() -> None:
38    rng = np.random.default_rng(33)
39    samples = 10_000
40    true_reflection = [0.72, -0.48, 0.24]
41    innovation = rng.normal(scale=0.25, size=samples)
42    x = np.asarray(
43        LatticeIIR(true_reflection, [1.0, 0.0, 0.0, 0.0]).process(innovation), dtype=float
44    )
45
46    # One-step prediction: input is delayed signal, desired is current signal.
47    predictor_input = np.r_[0.0, x[:-1]]
48    predictor = AdaptiveLatticeLadderNLMS(
49        initial_reflection=[0.0, 0.0, 0.0],
50        initial_taps=[0.0, 0.0, 0.0, 0.0],
51        mu_taps=0.04,
52        mu_reflection=0.001,
53        margin=1e-4,
54    )
55    error = np.asarray(predictor.adapt_block(predictor_input, x), dtype=float)
56
57    true_den = np.asarray(reflection_to_denominator(true_reflection), dtype=float)
58    learned_den = np.asarray(predictor.denominator, dtype=float)
59
60    print("true reflection:", np.round(true_reflection, 4).tolist())
61    print("learned reflection:", np.round(predictor.reflection, 4).tolist())
62    print("initial prediction MSE:", float(np.mean(error[:1000] ** 2)))
63    print("final prediction MSE:", float(np.mean(error[-1000:] ** 2)))
64
65    try:
66        import matplotlib.pyplot as plt
67    except Exception:
68        return
69
70    freq, true_db = response_db(np.array([1.0]), true_den)
71    _, learned_db = response_db(np.array([1.0]), learned_den)
72
73    fig, ax = plt.subplots(figsize=(8, 4))
74    ax.plot(freq, true_db, label="true all-pole spectrum")
75    ax.plot(freq, learned_db, "--", label="learned stable spectrum")
76    ax.set_title("AR spectral estimate from reflection coefficients")
77    ax.set_xlabel("normalized frequency × π rad/sample")
78    ax.set_ylabel("magnitude (dB)")
79    ax.legend()
80    fig.tight_layout()
81    out = artifact_dir() / "ar_spectral_estimation.png"
82    fig.savefig(out, dpi=150)
83    print(f"wrote {out}")
84
85
86if __name__ == "__main__":
87    main()