Matrix-valued AR spectral estimation
Tutorial goal
Compute a multichannel AR frequency response and spectral-matrix diagnostic.
Note
New to the terminology? See the lattice DSP concept map and the causality/data-use guide for how online, offline, block, and MIMO examples should be read.
Context
Multichannel spectra are matrices, not scalar curves. This example evaluates matrix-valued AR responses so channel interactions and cross-spectral behavior can be inspected.
Key idea and equations
For the matrix AR model, define the polynomial matrix
The transfer matrix from innovation \(e[n]\) to signal \(x[n]\) is
If the innovation covariance is \(\Sigma_e\), the spectral-density matrix is
Diagonal entries of \(S_x\) are auto-spectra. Off-diagonal entries are cross-spectra, so their magnitude and phase indicate frequency-dependent coupling between channels.
Causality and data use
The spectral-density calculation is an offline frequency-grid diagnostic of an already fitted VAR model. If the fitted model is stable, the corresponding time-domain VAR/IIR recursion is causal; the plot itself is not a streaming operation.
What this example verifies
This verifies the spectral interpretation of a fitted matrix AR model. The plotted spectral-density matrix separates auto-spectra from cross-spectra, while companion radius and reflection norms diagnose whether the fitted model can be used as a stable causal VAR/IIR recursion.
How to read the result
Use the auto-spectrum and cross-spectrum figures to see both per-channel power and cross-channel coupling, then check the spectral radius and reflection norms for stability.
Run command
python examples/matrix_ar_spectral_estimation.py
Run status
Return code: 0
Captured stdout
channels: 2
order: 2
frequency bins: 256
companion spectral radius: 0.725524
relative spectral-matrix error: 1.244e-02
channel-0 spectral peak rad/sample: 3.1416
prediction error eigenvalues: [1.003893 1.007857]
takeaway: multichannel Levinson supports matrix AR spectral estimates
Figures
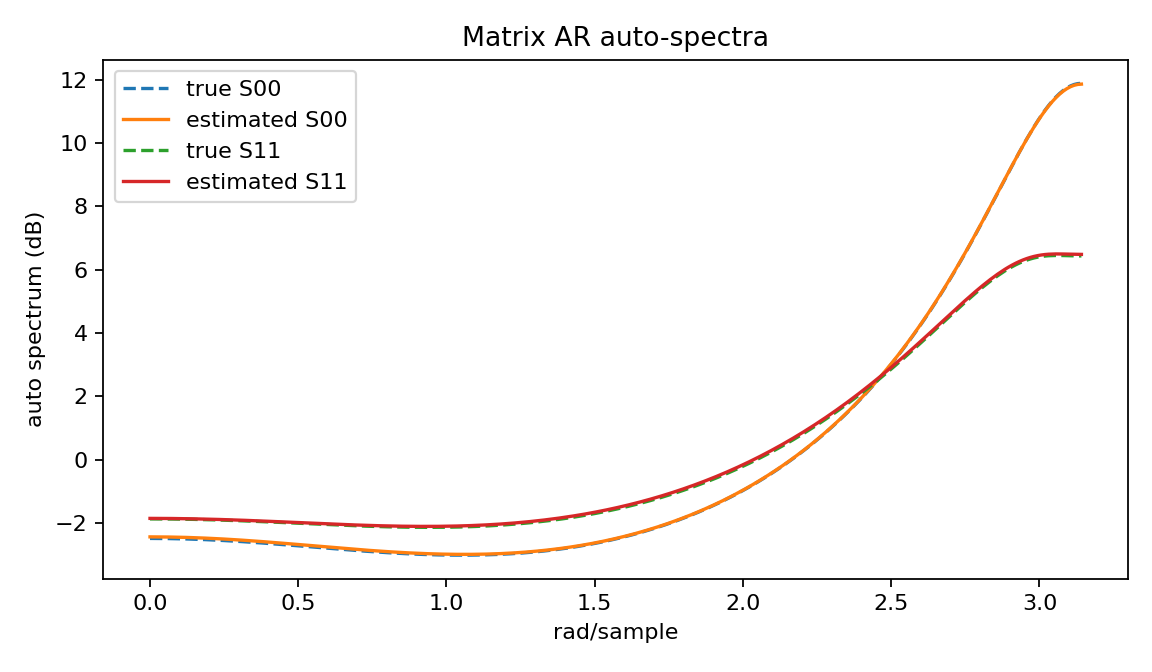
matrix_ar_auto_spectra.png
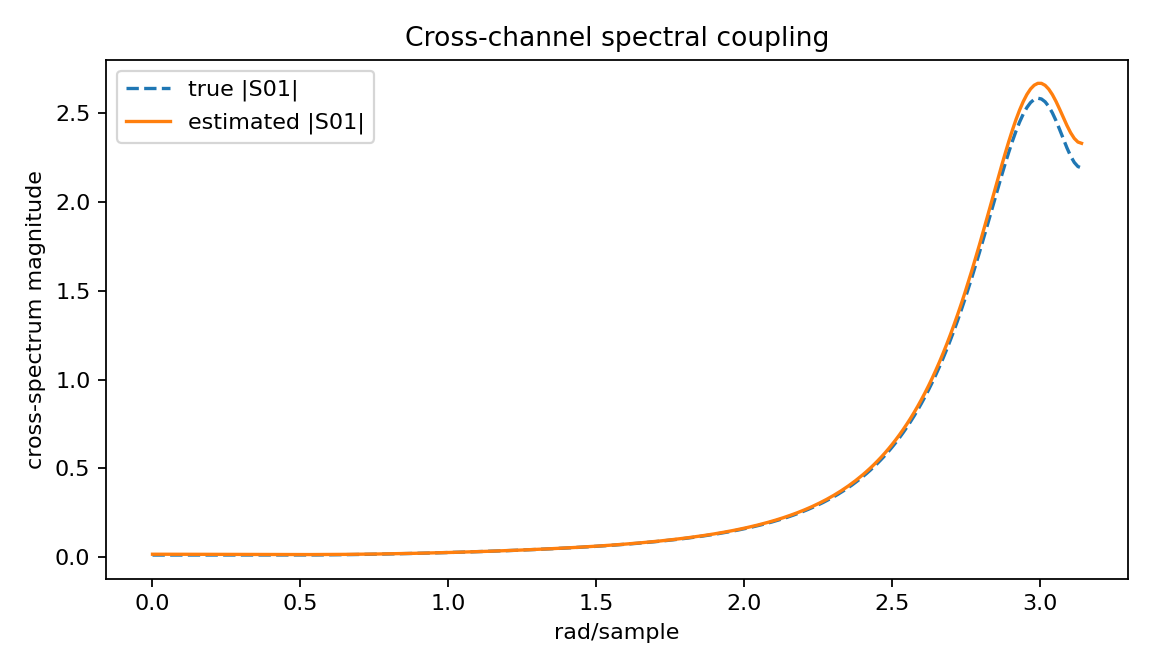
matrix_ar_cross_spectrum.png
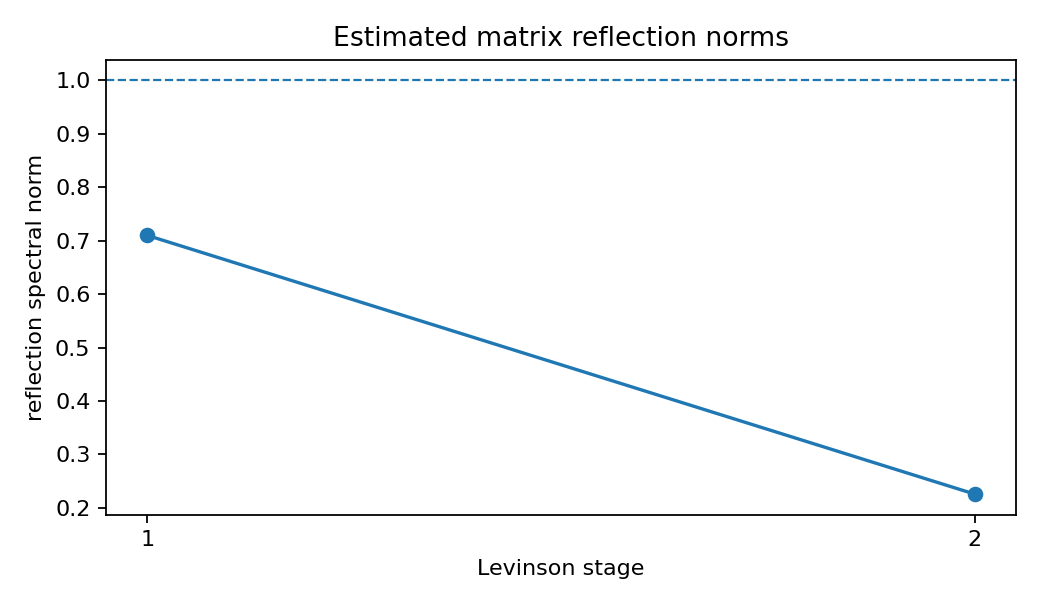
matrix_ar_reflection_norms.png
Source code
  1"""Matrix AR spectral estimation from multichannel autocorrelation."""
  2
  3from __future__ import annotations
  4
  5import os
  6from pathlib import Path
  7
  8import numpy as np
  9
 10import lattice_dsp as ld
 11
 12
 13def _artifact_dir() -> Path:
 14    path = Path(os.environ.get("LATTICE_DSP_ARTIFACT_DIR", "reports/example-artifacts"))
 15    path.mkdir(parents=True, exist_ok=True)
 16    return path
 17
 18
 19def simulate_var(coefficients: list[np.ndarray], samples: int, seed: int = 0) -> np.ndarray:
 20    rng = np.random.default_rng(seed)
 21    order = len(coefficients)
 22    channels = coefficients[0].shape[0]
 23    x = np.zeros((samples + 512, channels))
 24    noise = rng.normal(size=x.shape)
 25    for n in range(order, x.shape[0]):
 26        value = noise[n].copy()
 27        for lag, a_lag in enumerate(coefficients, start=1):
 28            value -= a_lag @ x[n - lag]
 29        x[n] = value
 30    return x[512:]
 31
 32
 33def spectrum_from_response(h: np.ndarray, noise_cov: np.ndarray) -> np.ndarray:
 34    s = np.empty_like(h)
 35    for i, hi in enumerate(h):
 36        s[i] = hi @ noise_cov @ hi.conj().T
 37    return s
 38
 39
 40def _db(values: np.ndarray) -> np.ndarray:
 41    return 10.0 * np.log10(np.maximum(np.real(values), 1e-14))
 42
 43
 44def _save_figures(
 45    w: np.ndarray, s_true: np.ndarray, s_est: np.ndarray, fit: ld.MultichannelARResult
 46) -> None:
 47    try:
 48        import matplotlib.pyplot as plt
 49    except ImportError:  # pragma: no cover - optional plotting dependency
 50        print("matplotlib is not installed; skipped figures")
 51        return
 52
 53    out_dir = _artifact_dir()
 54
 55    fig, ax = plt.subplots(figsize=(7.2, 4.2))
 56    for channel in range(s_est.shape[1]):
 57        ax.plot(
 58            w, _db(s_true[:, channel, channel]), linestyle="--", label=f"true S{channel}{channel}"
 59        )
 60        ax.plot(w, _db(s_est[:, channel, channel]), label=f"estimated S{channel}{channel}")
 61    ax.set_xlabel("rad/sample")
 62    ax.set_ylabel("auto spectrum (dB)")
 63    ax.set_title("Matrix AR auto-spectra")
 64    ax.legend(loc="best")
 65    fig.tight_layout()
 66    path = out_dir / "matrix_ar_auto_spectra.png"
 67    fig.savefig(path, dpi=160)
 68    plt.close(fig)
 69    print(f"wrote {path}")
 70
 71    fig, ax = plt.subplots(figsize=(7.2, 4.2))
 72    ax.plot(w, np.abs(s_true[:, 0, 1]), linestyle="--", label="true |S01|")
 73    ax.plot(w, np.abs(s_est[:, 0, 1]), label="estimated |S01|")
 74    ax.set_xlabel("rad/sample")
 75    ax.set_ylabel("cross-spectrum magnitude")
 76    ax.set_title("Cross-channel spectral coupling")
 77    ax.legend(loc="best")
 78    fig.tight_layout()
 79    path = out_dir / "matrix_ar_cross_spectrum.png"
 80    fig.savefig(path, dpi=160)
 81    plt.close(fig)
 82    print(f"wrote {path}")
 83
 84    fig, ax = plt.subplots(figsize=(6.5, 3.8))
 85    stages = np.arange(1, len(fit.reflection_spectral_norms) + 1)
 86    ax.plot(stages, fit.reflection_spectral_norms, marker="o")
 87    ax.axhline(1.0, linestyle="--", linewidth=1.0)
 88    ax.set_xlabel("Levinson stage")
 89    ax.set_ylabel("reflection spectral norm")
 90    ax.set_title("Estimated matrix reflection norms")
 91    ax.set_xticks(stages)
 92    fig.tight_layout()
 93    path = out_dir / "matrix_ar_reflection_norms.png"
 94    fig.savefig(path, dpi=160)
 95    plt.close(fig)
 96    print(f"wrote {path}")
 97
 98
 99def main() -> None:
100    true_coefficients = [
101        np.array([[0.55, -0.08], [0.10, 0.38]]),
102        np.array([[-0.22, 0.04], [-0.03, -0.14]]),
103    ]
104    x = simulate_var(true_coefficients, samples=60000, seed=9)
105    r = ld.multichannel_autocorrelation(x, order=2)
106    fit = ld.block_levinson_durbin(r, order=2)
107
108    w = np.linspace(0, np.pi, 256)
109    h_true = ld.matrix_ar_frequency_response(np.asarray(true_coefficients), w)
110    h_est = ld.matrix_ar_frequency_response(fit.coefficients, w)
111    s_true = spectrum_from_response(h_true, np.eye(2))
112    s_est = spectrum_from_response(h_est, fit.prediction_error.real)
113
114    rel_spectrum_error = np.linalg.norm(s_est - s_true) / np.linalg.norm(s_true)
115    peak_bin = int(np.argmax(np.real(s_est[:, 0, 0])))
116
117    print("channels:", 2)
118    print("order:", fit.order)
119    print("frequency bins:", len(w))
120    print("companion spectral radius:", f"{ld.companion_spectral_radius(fit.coefficients):.6f}")
121    print("relative spectral-matrix error:", f"{rel_spectrum_error:.3e}")
122    print("channel-0 spectral peak rad/sample:", f"{w[peak_bin]:.4f}")
123    print(
124        "prediction error eigenvalues:", np.round(np.linalg.eigvalsh(fit.prediction_error).real, 6)
125    )
126    print("takeaway: multichannel Levinson supports matrix AR spectral estimates")
127
128    _save_figures(w, s_true, s_est, fit)
129
130
131if __name__ == "__main__":
132    main()